

From Climate Risk to Community Resilience: A Fresh Framework to Measure Connectivity
Summer in many parts of the world has become synonymous with wildfire. Ominous, smoke-filled skies are replacing clear blue days. Evacuation orders, accounts of near-misses and stories of heartbreaking loss increasingly dominate local and national news.
While some communities face greater risk than others, every community needs to plan for emergencies and know where and how all its residents, including the most vulnerable, will evacuate during wildfires, floods or severe weather events.
How Networks Perform Under Stress
As climate-related hazards increasingly threaten regional communities and urban centres alike, municipalities face a critical question: where should they prioritize limited resources to strengthen resilience?
HDR recently developed a tool to help the Halifax Regional Municipality (HRM) answer this question, in response to the 2023 fire season, the worst on record in Nova Scotia.
Evacuation Stress Test: Upper Tantallon Fire, May 2023
On the afternoon of May 28, 2023, a fire started in the Westwood Hills subdivision, a suburb of Halifax. The fire quickly escalated into what would become the worst wildland-urban interface fire in HRM history.
Despite extensive efforts to control and extinguish the wildfire, it consumed more than 900 hectares, required the evacuation of 16,400 people, and resulted in the loss of approximately 200 structures, including 151 homes.
The wildfire exposed how the evacuation efforts were constrained by limited road connectivity and highlighted systemic access vulnerabilities in subdivision design and regional transportation corridors. Many communities relied on a single access route or multiple exits that ultimately converged onto the same constrained roadway.
A Data-Driven Decision-Support Framework
Our transportation planning and geographic information system (GIS) specialists joined forces to develop a geospatial Community Connectivity Index (CCI) for HRM that integrated transportation network connectivity, geophysical hazard exposure, and social and mobility vulnerabilities to identify communities at greatest risk during an emergency.
The HDR team used graph theory — the mathematical study of networks — to quantify road segments and intersections and measure how connected they are. This provided data on how easily people or vehicles can move through them and how resilient they are to disruptions, such as bridge closures or blocked routes.
By combining this with publicly available data, such as census information, precipitation records, and historical wildfire burn areas, they could identify the communities most vulnerable from a network, demographic, and environmental perspective.
The analysis uses three sub-indices to assess the vulnerability of road segments, measuring risks related to people and communities, transportation infrastructure, and exposure to wildfire and flood hazards.
- The Socioeconomic and Mobility Vulnerability Index (SMVI) incorporates census data such as household income, age, immigration status, and access to vehicles. These indicators help identify populations that may face additional challenges during emergencies, including evacuations and disruptions to essential services.
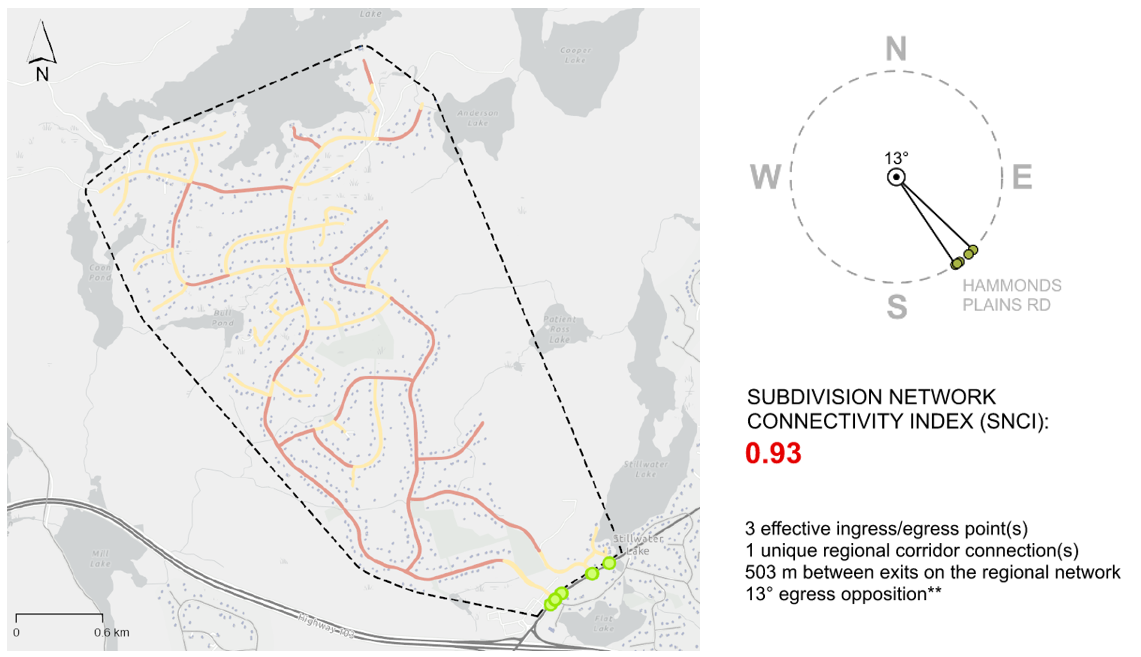
- The Network Connectivity Index (NCI) assesses how road network disruptions can affect communities. It analyzes the importance of individual road segments, the number of people who rely on them, and the potential impacts if they become inaccessible and assigns a score based on the number and spacing of exits. By combining transportation network analysis with population data, the index helps identify critical links that support community connectivity and resilience.
- The Geophysical Vulnerability Index (GVI) evaluates the exposure of road segments to natural hazards, including wildfire and flood risks such as river flooding or coastal storm surges. By mapping current and projected hazard data to road segments, the index highlights infrastructure that may be most vulnerable to climate-related events.
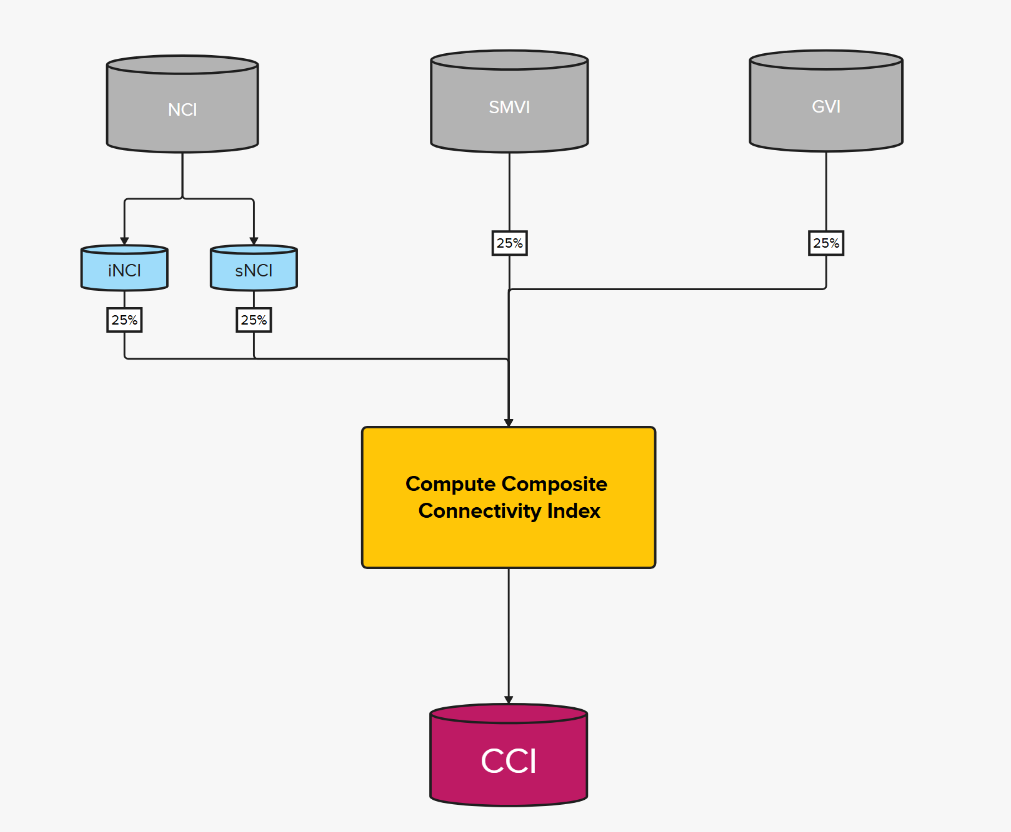
The three indices feed into the CCI, a GIS-based assessment tool that quantifies access risks for communities. CCI results were aggregated at the subdivision level so that the region had scores and ranks for each subdivision within the area. In emergency evacuation scenarios, this provides a municipality-wide, data-driven decision-support framework applicable to other regions or even entire provinces.
While GIS, vulnerability mapping, hazard assessments, and transportation network analysis are well-established techniques, the project applied them in a new way by integrating them into a subdivision-scale emergency egress planning framework.
An Innovative — and Repeatable — Approach to Hazard Modelling for Municipalities
For decades, transportation and subdivision planning have relied on simple access-count standards as proxies for safety. Simply connecting a subdivision to a highway might not be enough. Climate-driven emergencies are revealing a hard truth: resilience is not about the number of exits; it is about how entire networks perform under stress.
The Community Connectivity Index helps communities understand how wildfire, flood, social vulnerability, and transportation networks interact to compound risks. By creating data-driven, repeatable models and keeping humans at the centre, the CCI enables municipalities to test scenarios, evaluate investments, and prioritize actions to strengthen community resilience.


