
Reservoir Modeling Identifies Water Quality Enhancement Strategies
Water Quality Modeling
In the late 1990s, the New York City Department of Environmental Protection completed an extended special study program for its Croton Water Supply System to evaluate alternatives to construction of a new water filtration plant. Five non-filtration water quality goals were established — covering source water and delivered water — for evaluating the Croton System’s ability to provide consistent drinking water throughout the year. While the Croton System consistently meets all Safe Drinking Water standards established by the U.S. Environmental Protection Agency and enforced by the New York State Department of Health, its reservoirs have exhibited elevated levels of color, iron, manganese and total organic carbon during certain periods of the year. Secondary drinking water standards for color were occasionally exceeded, and at the time, disinfection by-product levels were not expected to meet stricter standards associated with the Stage 1 Disinfection/Disinfectant By-Products Rule. In addition, water quality problems were partially attributable to eutrophication in the Croton System, and the associated bottom water hypoxia/anoxia (low dissolved oxygen). These challenges resulted in occasional shutdowns of the System.

The Croton System is part of the water supply system serving the New York City metropolitan area and other municipalities along the aqueduct route. The Muscoot and New Croton reservoirs are the two most downstream reservoirs in a system of 12 interconnected reservoirs located in Putnam and Westchester counties (north of NYC and on the eastern side of the Hudson River). These reservoirs receive an annual average inflow of about 280 cubic feet per second at the upstream end of the reservoir system, including an additional 170 cubic feet per second from tributaries entering along the length of the reservoirs.
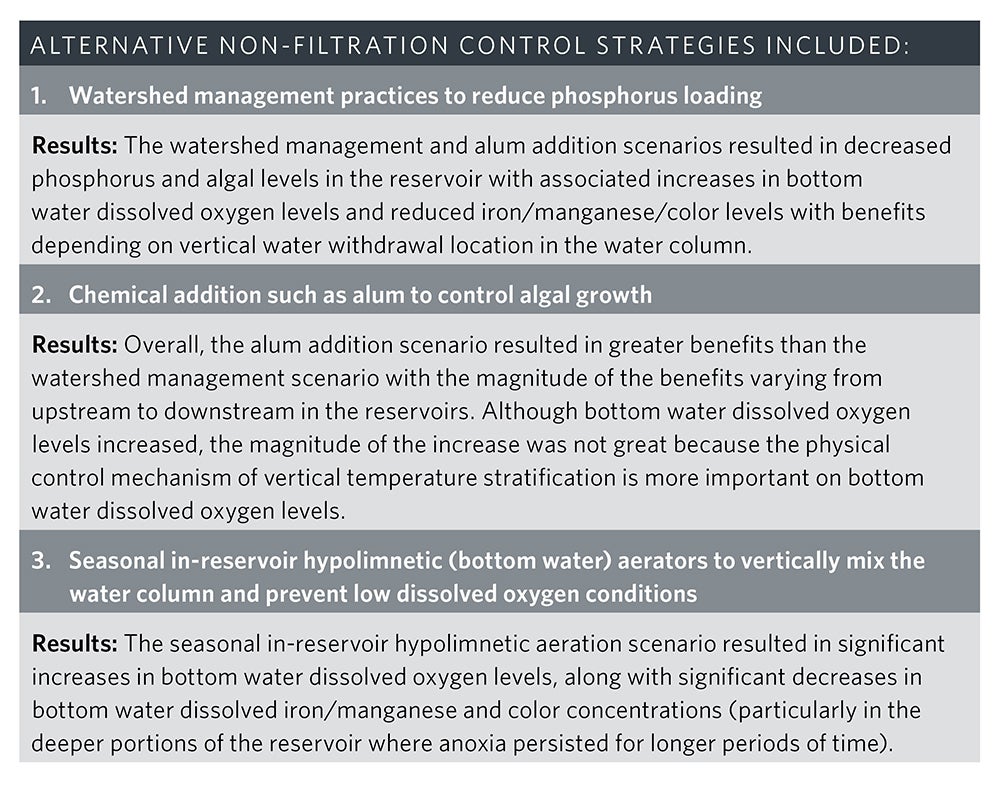
To investigate these issues, DEP partnered with HDR to complete modeling of the New Croton and Muscoot reservoirs that included water quality response to hydrodynamics (circulation) and eutrophication conditions. The primary objectives of the modeling were to: develop a quantitative tool to assess causes of elevated color; quantify the sources of TOC (a precursor to disinfectant by-product formation); and assess the effectiveness of alternative control strategies such as watershed nutrient reduction, hypolimnetic aeration and alum addition. Ultimately, the reservoir modeling system was used to evaluate alternative control strategies to determine whether they provided a viable approach for meeting reservoir water quality objectives. Some of these strategies considered the impact watershed nutrient addition and point source discharges under a One Water evaluation approach.
The reservoir modeling system included a water transport model that allowed calculation of water transport through the reservoir to the drinking water intake and, more importantly, the vertical temperature stratification processes that lead to low dissolved oxygen levels in the bottom layer of the water column (hypolimnion). Coupled with the water transport model, an eutrophication model calculates the effect of watershed nutrient loading on in-reservoir water quality parameters such as nitrogen, phosphorus, TOC, algae (phytoplankton), color, iron, manganese and dissolved oxygen. The eutrophication model also included a sediment flux model that explicitly links particulate organic matter settling to reservoir sediments to the subsequent diagenesis (decay) in the sediments and the flux of nutrients, iron and manganese back to the water column. This modeling system allows the assessment of various primary and secondary impacts associated with reservoir eutrophication and watershed nutrient loading (primarily phosphorus). Watershed nutrient loading primarily affects reservoir nutrient and algal levels but can lead to the following secondary impacts:
- Eutrophication impacts on drinking water color, taste and odor problems.
- Elevated algal levels affecting reservoir TOC and color levels, which in turn can affect the formation of disinfection by-products and, in particular, haloacetic acids.
- Vertical temperature stratification resulting in low bottom-water dissolved oxygen levels, which leads to sediment release of iron and manganese (and nutrients) along with associated impacts on color, taste and odor.
DEP has collected extensive water quality data in the reservoirs since 1984. These data include monthly sampling for the following parameters: dissolved oxygen; temperature; pH; conductivity; color; nutrients (nitrogen and phosphorus); chlorophyll-a; TOC; iron and manganese. This data shows the typical seasonal temperature stratification evolution (i.e., increasing stratification from spring through the summer/fall); low bottom-water dissolved oxygen levels; elevated bottom water iron and manganese; and increased bottom water nutrient levels (e.g., ammonia nitrogen and soluble reactive phosphorus). In addition, chlorophyll-a levels are elevated throughout the spring/summer period until surface nutrient supplies are exhausted or cooler temperatures reduce algal growth.
The reservoir modeling system was calibrated to an extensive dataset for an annual period so that vertical temperature stratification, bottom water dissolved oxygen dynamics and eutrophication processes are tested over a full hydrologic cycle. Model segmentation included laterally averaged model segments along the longitudinal axis of the reservoir
(including a number of tributary arms) and vertically throughout the water column. Model inputs included: river/tributary flow; temperature and water quality loads; withdrawals; and meteorology (e.g., precipitation, evaporation, wind speed). The resulting model-data comparisons at in-reservoir stations indicated that the model reasonably reproduced measured reservoir levels, temperature, nutrients, chlorophyll-a, TOC, color, iron and manganese, and was considered suitable for use as a quantitative tool to evaluate alternative non-filtration control strategies.
The development and application of a reservoir modeling system can greatly benefit the evaluation and planning
of reservoir management options to improve or maintain drinking water quality. For both water transport and water quality fate processes, a well-calibrated reservoir model provides a quantitative framework for evaluating a wide range of management alternatives. These watershed management alternatives can include treatment nutrient removal improvements from wastewater treatment plants, nonpoint source BMPs to reduce nutrient runoff loads, physical controls (hypolimnetic aeration or mixing), and evaluation of trade-offs between vertical withdrawal locations. These numerical evaluations allow alternatives to be considered alone, in combinations or coupled with drinking water treatment options so that a technically sound and economically justified management plan can be developed.
In addition, the water transport or hydrodynamic model can be used to determine the travel time from source water entering the reservoir system to the intake location. This can be important for planning treatment response to an incoming contaminant to aid in planning for treatment initiation or for determining when different source water should be used. The bottom line is that a reservoir modeling system can be an important evaluation tool in the decision-making toolbox and provides opportunities to evaluate One Water solutions to enhance water quality and protect our drinking water supplies.


