
MnDOT Risk-Based Traffic Safety Predictive Analysis

MnDOT Risk-Based Traffic Safety Predictive Analysis
Analyzing Driver Behavior to Estimate Probability of Fatal or Serious Injury Crashes by Road Segment
- Developed and tested crash risk model for all trunk highway and County State-Aid Highway in Minnesota
- Driver behavior factors identified as strongest predictors of serious crashes
- Innovative online tool combining crash, citation, conviction and roadway data into single platform
- Artificial intelligence chatbot for non-technical users to easily search safety data
For more than 20 years, Minnesota’s Toward Zero Deaths program has helped reduce road deaths and serious injuries through roadway improvements, enforcement and safety programs. But as progress began to level off, the Minnesota Department of Transportation looked for more innovative ways to identify where fatal and serious injury crashes were most likely to occur so the agency could intervene before they happened.
HDR partnered with the MnDOT to use risk-based predictive analysis to evaluate future crash risk across the state’s roadways. Instead of examining roadway characteristics or geometry after crashes happen, this approach instead assessed whether evaluating driver behavior data could identify where future risk was highest.
What began as a pilot in one MnDOT district expanded to multiple districts before growing into a statewide program that covers all trunk highways and County State-Aid Highways. The resulting platform helps agencies prioritize and coordinate engineering, enforcement, education and emergency medical services where they can have the greatest impact at further reducing serious injury and fatal crashes.
Predicting Future Crash Locations
The project team developed a centralized database that combined several years of roadway characteristics, crash history, weather data, State Patrol citations, court convictions and other geographic information. We geographically aligned the data with more than 7,300 roadway segments and created additional derived measures, such as number of days between crashes and estimated seatbelt usage, that helped describe driver behavior, enforcement activity and crash history.
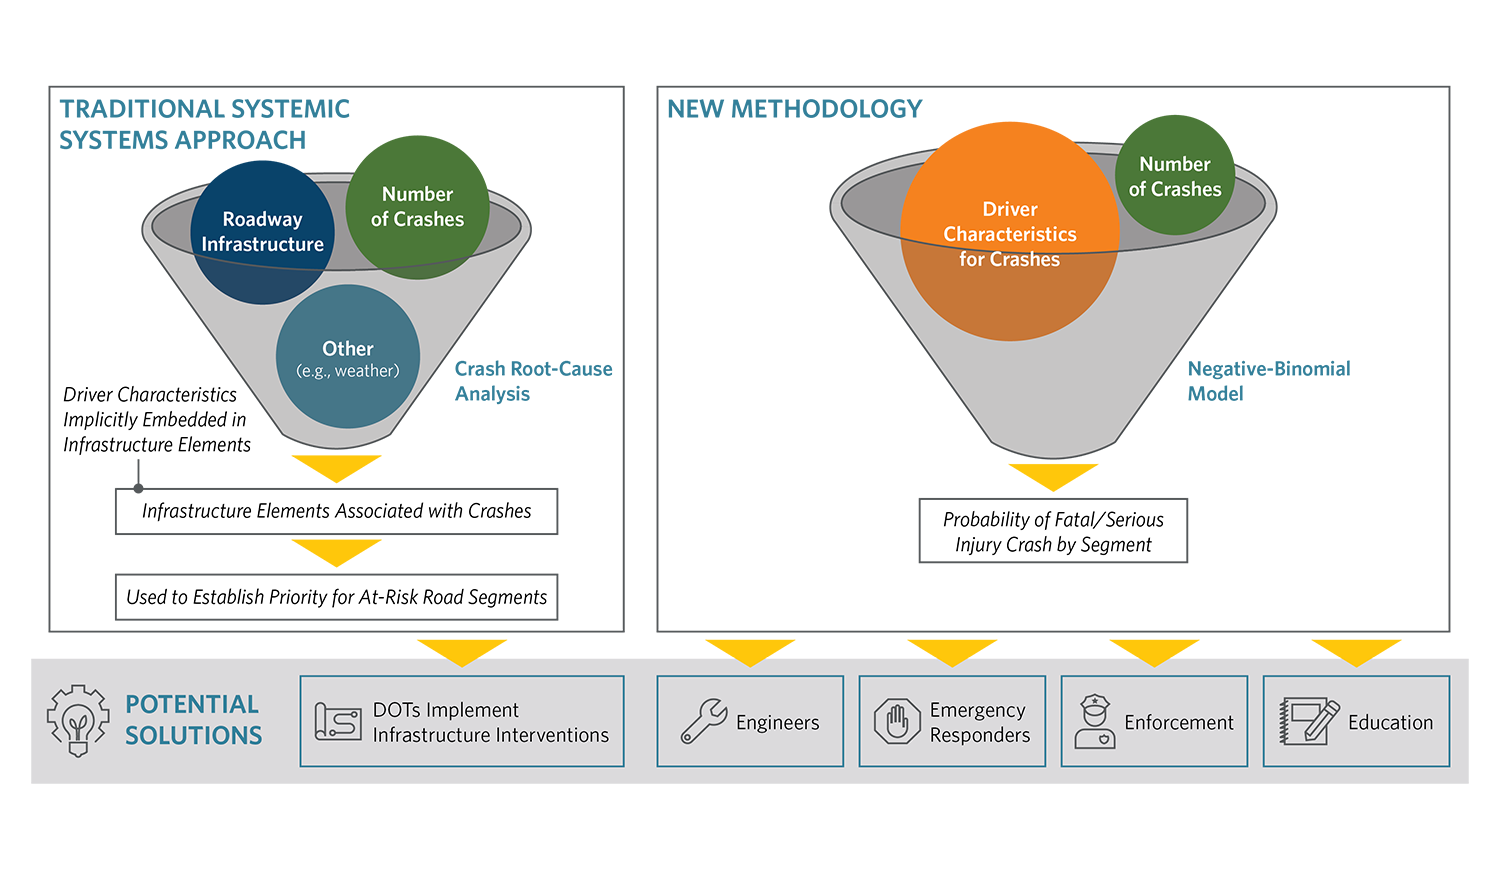
The model evaluated dozens of explanatory variables, including roadway, behavioral, environmental and enforcement characteristics against historical fatal and serious injury crash outcomes. Through statistical selection, the team identified factors most closely associated with severe crashes and retained them in the final model. One of the most significant findings was that driver behavior proved to be a stronger indicator of future severe crashes than many traditional roadway characteristics. Along with roadway classification and segment length, key factors included crashes involving younger drivers, older drivers, speeding, impaired driving and unbelted occupants.
The resulting model scores each roadway segment based on the likelihood of fatal and serious injury crashes. Agencies can then examine contributing factors and prioritize potential interventions such as increased enforcement. For example, additional investigation of a high-risk roadway segment may identify nearby drinking establishments that could influence driver behavior and support targeted enforcement efforts.
Making Data Accessible
To translate the predictive model analysis into a practical tool for non-technical users, our team developed the web-based Crash Foresight Tool using Esri ArcGIS Online technology. The interactive application enables users to identify high-priority roadway segments, evaluate predicted crash risk and explore historical crash, enforcement and conviction data in a single platform, helping agencies better understand risk factors and target proactive safety investments.
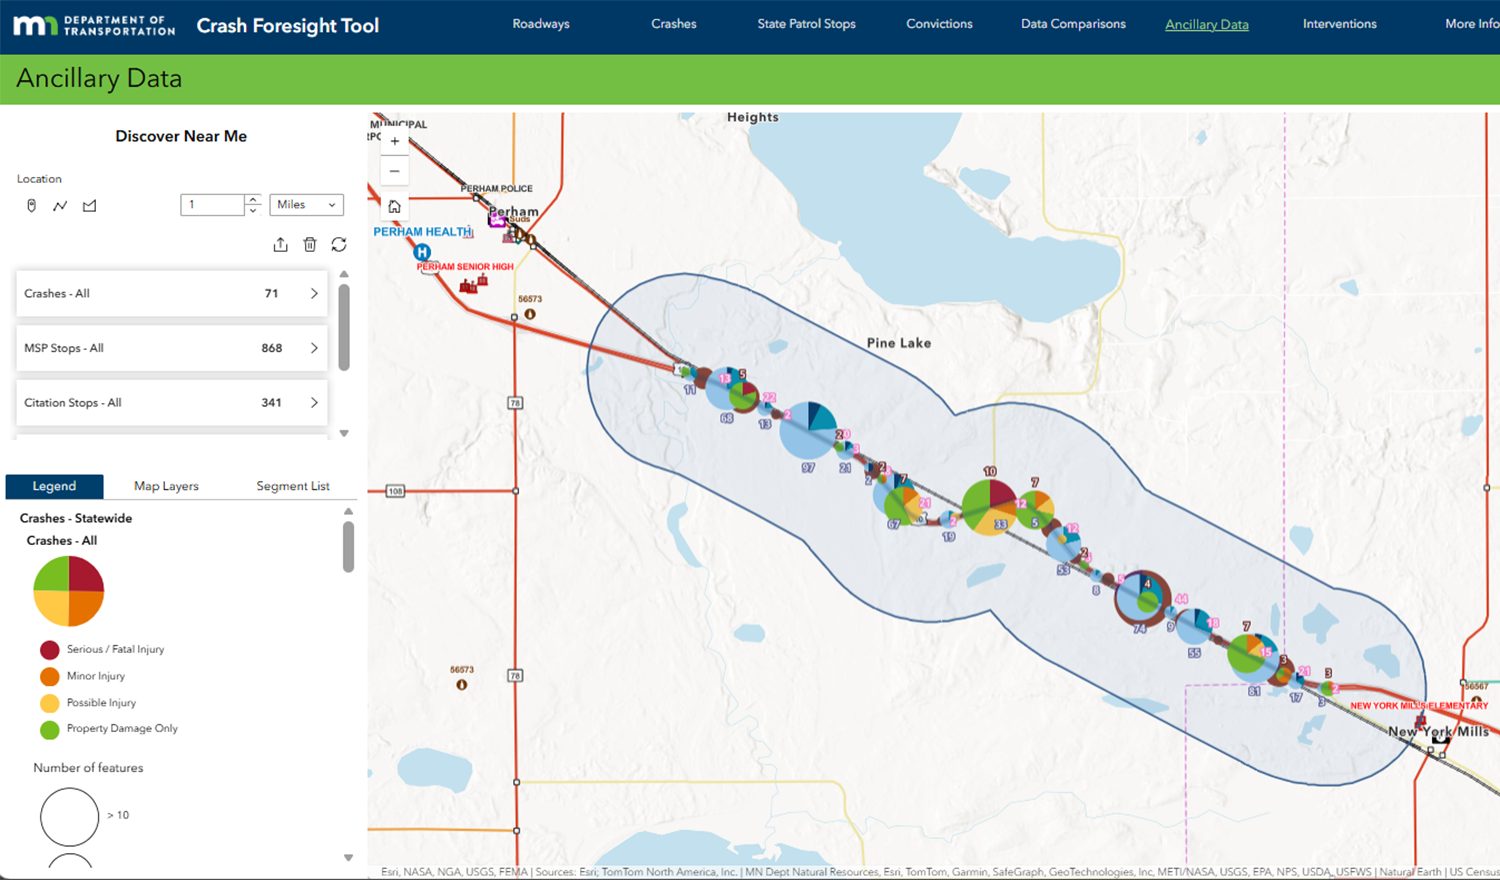
Using the tool, transportation agencies, law enforcement, emergency responders and others invested in safety can identify high-risk road segments, understand the factors contributing to that risk and coordinate potential interventions before severe crashes occur.
We also created a chatbot that provides conversational access to the system. Instead of searching through dashboard data tables, users can ask questions about roadway segments, crash trends or contributing factors and receive summaries and visualizations.
Coordinating to Save Lives
The information is being used to support safety decisions across Minnesota. Emergency response organizations are evaluating high-risk locations for staging whole blood closer to where severe crashes are most likely to occur. State Patrol has incorporated the Crash Foresight Tool into patrol planning and begun identifying high-risk corridors as station-level priorities. For example, increased speed enforcement along portions of U.S. Highway 10 in Clay and Becker counties corresponded with a reduction in fatal and serious injury crashes from an average of 4.5 per year between 2019 and 2024 to zero in 2025.
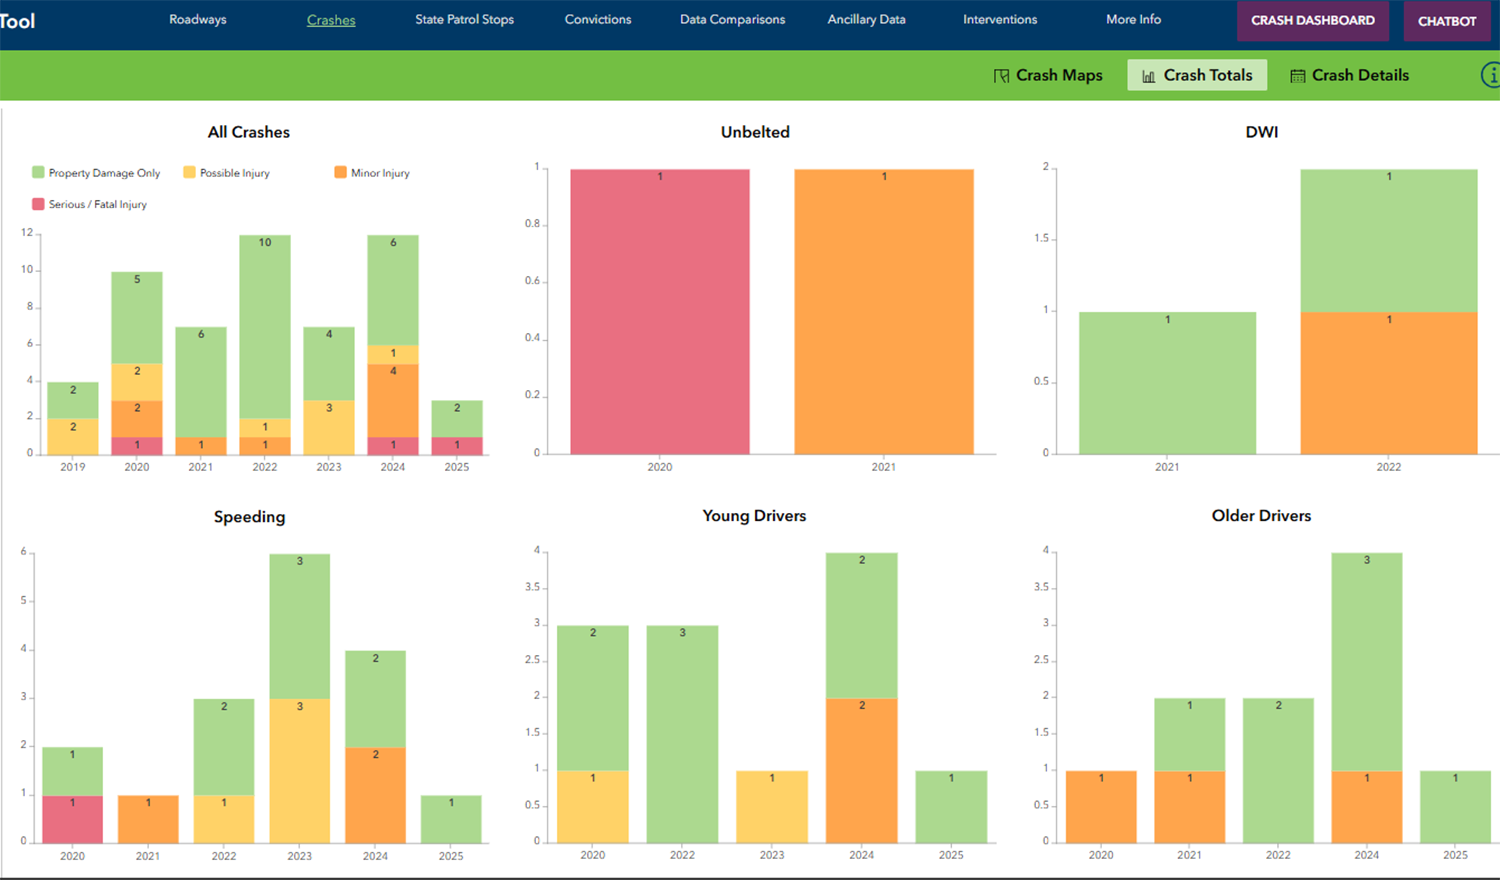
The resulting analysis and supporting tools continue to be updated and validated as new data becomes available. Because the methodology relies on accessible data and statistical techniques, it can also be replicated by other transportation agencies seeking to develop their own risk-based safety programs.


