
Experts Talk: How Better Vehicle Crash Data Can Improve Road Safety With Michael Pawlovich
Experts Talk is an interview series with technical leaders from across our transportation program.
Examining the Importance of Crash Data Collection to Support Better Decision-Making
Eliminating fatal and serious injury crashes begins with the collection and analysis of reliable and accurate motor vehicle crash data. This data can be challenging to collect but enables the identification of high-risk areas and the determination of effective safety countermeasures.
Michael Pawlovich, P.E., is a senior traffic safety engineer with more than 25 years of traffic safety, traffic engineering, crash data analysis and research experience. He has become an industry leader in analyzing traffic crash data and developing strategies to streamline collection. In addition to his more than 17 years as a traffic safety and crash data engineer for the Iowa Department of Transportation, Pawlovich has taught civil engineering at the university level for more than a decade.
In this interview, Pawlovich reviews how traffic crash data has traditionally been collected, discusses the challenges with the current process, and details what improvements agencies can make.
Q. How is vehicle crash data collected, stored and used to improve roadway safety?
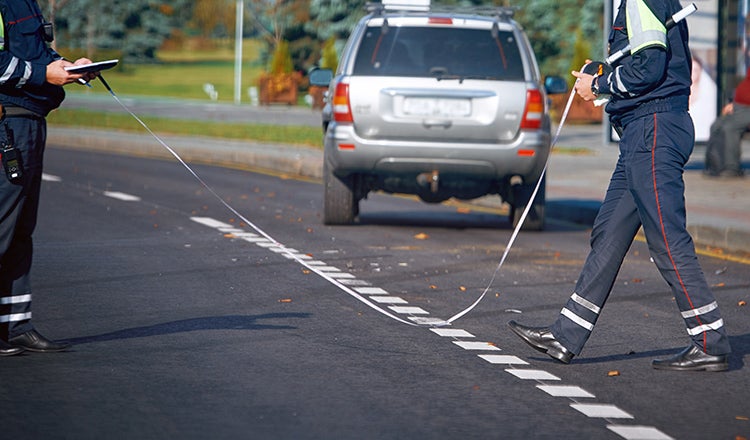
A. Across the U.S., law enforcement officers collect critical crash data because they are often first on the scene. They document details such as location, driver condition, injury severity, vehicle type, road characteristics and other circumstances. Many states have their own crash reporting forms based on national guidelines. This data creates the foundation for safety analysis and decision-making.
Most states have transitioned from paper to electronic systems that allow officers to submit data more efficiently and accurately into state databases for analysis, improving turnaround time and quality. During my time at the Iowa DOT, I saw firsthand the timeline for finalizing annual edited crash data decrease from about 14 months after year-end to just four months.
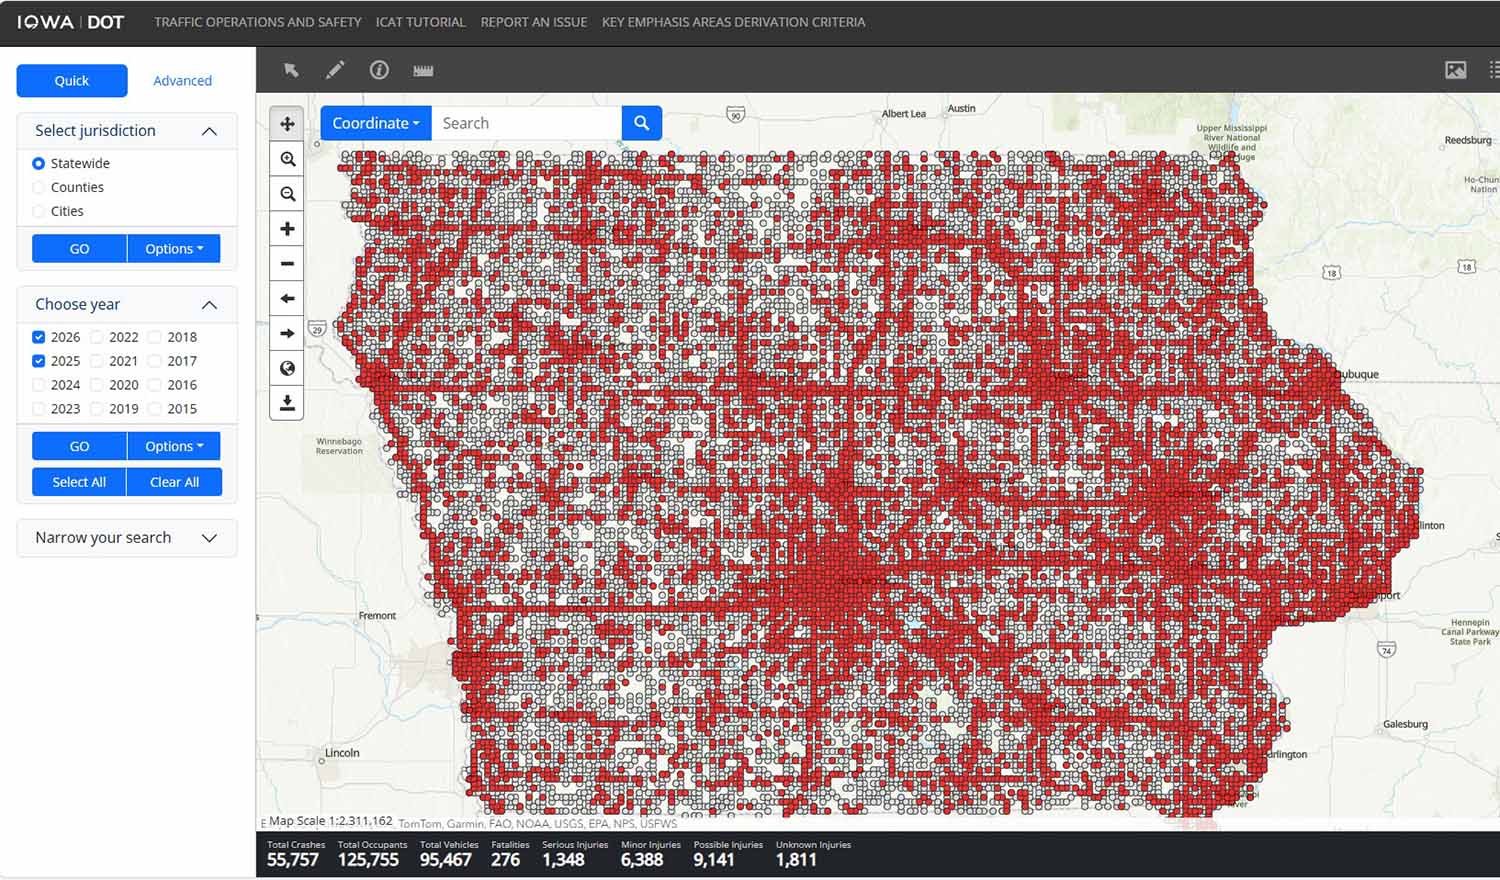
Once collected, crash data feeds into centralized, statewide databases and is made available through tools like Iowa’s Crash Analysis Tool (ICAT).
States use this data to identify high-risk locations for needed improvements, such as modifying intersections, adding median barriers or improving signage. It also reveals opportunities for systemic improvements. For example, if data shows frequent crashes on rural curves or two-lane highways, agencies can apply proven, low-cost countermeasures like paved shoulders, rumble strips and wider edge lines to similar sites statewide. This focuses systemic improvements on areas where data shows the greatest benefit.
Locally, city and county agencies also use the data to develop road safety plans, reveal and address problem areas, and prioritize safety improvement projects. Enforcement and education teams use crash data to plan safety campaigns and communicate general public safety awareness, while driver licensing and vehicle registration agencies use it to identify safety concerns and deliver targeted messaging.
Q. What challenges exist in crash data collection processes?
A. While crash data is fundamental to roadway safety analysis, reports are only as good as what gets recorded at the scene. Officers are juggling many responsibilities at a crash scene, which reduces attention to gathering crash data. Incomplete or inaccurate data makes analysis and interpretation less certain and thus makes finding the best countermeasures more difficult. This is more critical for locations with limited crash history.
I have seen how data quality and data interpretation can impact analysis. On one project involving two intersections, many crashes were incorrectly attributed to the wrong intersection. If the crashes had not been examined individually, the more problematic intersection would have appeared safer than it was, potentially affecting the choice and installation of countermeasures.
In another case, a dataset showed more crashes than vehicles, likely due to missing entries in the vehicle type field. These blanks stemmed from short-form reports used for single-vehicle, wild animal and property-damage-only crashes, which did not require any vehicle documentation. Such discrepancies should prompt the analyst to explore further.
On another project, missing “contributing circumstances” fields made it harder to diagnose left-turn crashes. While solutions were still being developed, incorrect or irregular data required further manual analysis. In other words, if an analyst is not familiar with a state’s data, spending time reviewing and understanding the data is a good first step.
Other challenges include inconsistent reporting between jurisdictions and delays in finalizing reports. Usable data from more severe and complex crashes can take time to reach analysts. Electronic reporting technology has helped, but limitations remain, particularly for recent crashes in which details are determined as the investigation unfolds. Generally, these delays only apply to the most current data and have been addressed before the year-end data file is released.
Q. How can agencies improve crash data collection and analysis?
A. Agencies can make manageable, meaningful changes by asking themselves, “What are the data deficiencies and how can we remove them?” The National Highway Traffic Safety Administration (NHTSA) has a traffic records assessment program which brings in national experts to review crash, roadway, driver, vehicle, citation/adjudication, and injury surveillance/emergency medical system data that is self-reported by a state. A traffic records assessment can find data collection and management deficiencies and recommend potential improvements.
Meaningful improvements to officer training and efficiency are equally important. Complex forms can be a hindrance for responders. When redesigning the Iowa crash form in 2001, we committed to limiting data fields as much as possible. In Iowa, we revamped the data editing and validation process and matched data fields and elements to the Model Minimum Uniform Crash Criteria (MMUCC), a crash data collection guideline in the United States.
Furthermore, validations embedded in the electronic data collection system can return warnings and errors to officers inputting data, encouraging them to make corrections and understand data inconsistencies to correct them before submission.
Q. What can be done to help officers see the importance of accurate crash reporting?
A. It is important to show the value of crash data to enforcement personnel. When officers see how details in their reports impact local safety efforts — such as statistics that reveal fewer deadly and severe crashes — they are more motivated to accurately collect data.
During my time at Iowa DOT, a local city police patrol commander used data collected by officers — including crashes, citations and crimes — to show how their efforts directly affected their community. Another idea is to regularly share trends from the crash data. In the same community, an analysis revealed citation numbers spiked at the beginning of each month, highlighting the need for more consistent enforcement to encourage steady driver compliance.
Q. What role will technology play in the future of crash data analytics and collection?
A. The use of supplemental technology on scene, such as barcode readers and real-time access to driver and vehicle databases, allows officers to collect data more quickly and accurately. Additionally, some enforcement agencies have lidar tools to quickly survey the crash scene, particularly for more severe or multi-vehicle crashes. While these gains were realized years ago, improvements continue through better validations, improved systems, and collection of more refined data, e.g., drug types and not simply drug use.
Similarly, technology and methodological improvements have also occurred for analytics. As crash and roadway data are mappable, GIS has expanded with both improved crash data as well as roadway, traffic and other data. Analysts and engineers can see locations with higher crash incidence within GIS, allowing visual confirmation of data and connections to other data. Heat maps can be excellent tools to communicate problem areas to clients and serve as an early indicator of locations to analyze further.
The development of online tools for accessing, visualizing, and analyzing the data has expanded its use and availability. Increased access can result in additional scrutiny and public input, which is generally informative, as most people are interested in reducing crash deaths and serious injuries. While at Iowa DOT, we transitioned from limiting data access to government agencies, to providing it to consultants and others working with the DOT, counties and cities to expanding access online to anyone. While expanded access comes with the potential for misinterpretation, my experience is that the positives massively outweigh the negatives, particularly if agencies are familiar with and use the data themselves.
Looking ahead, artificial intelligence will likely play a growing role in analyzing and reviewing large amounts. I suspect its ability to sift through large amounts of data quickly will be helpful, but human involvement will still be needed to examine the results. Personally, I am more excited about the development of business intelligence (BI) and visualization applications.
Inspiration and Advice
Q. How did you get involved in transportation data and statistical analysis?
A. My journey began with a natural inclination toward coding, data analysis, software and statistics — coinciding with the rise of personal computers. Before college, I had experience solving coding puzzles and using spreadsheets. As an undergraduate, I updated Pascal code for Iowa’s non-GIS crash analysis tool. My master’s thesis involved developing a GIS-based analysis tool, which continued into my doctoral studies. For my dissertation, I applied hierarchical Bayesian statistics using a Poisson-Gamma model for network screening. Later at Iowa DOT, I revamped the GIS tool to align with the 2001 crash report update and developed many other tools, resources and references.
Q. What advice do you have for someone considering a career working with traffic safety data?
A. Do not force it. You will quickly know whether traffic safety data analysis is for you. While at Iowa DOT, I worked with many interns who were capable but not drawn to this field. If you are interested, learn everything you can about data guidelines like MMUCC and MIRE, data standards such as ANSI D-16 and ANSI D-20, and Highway Safety Manual (HSM) methodologies. Understand FHWA and NHTSA programs. Consider roadway safety professional certifications like RSP1 and RSP2 and expand your GIS, Excel and software knowledge. Perhaps learn to code. Most importantly, engage with knowledgeable, experienced colleagues and be willing to learn.
Each Experts Talk interview illuminates a different aspect of transportation infrastructure planning, design and delivery. Check back regularly to discover new insights from the specialized experts and thought leaders behind our award-winning, full service consulting practice.


