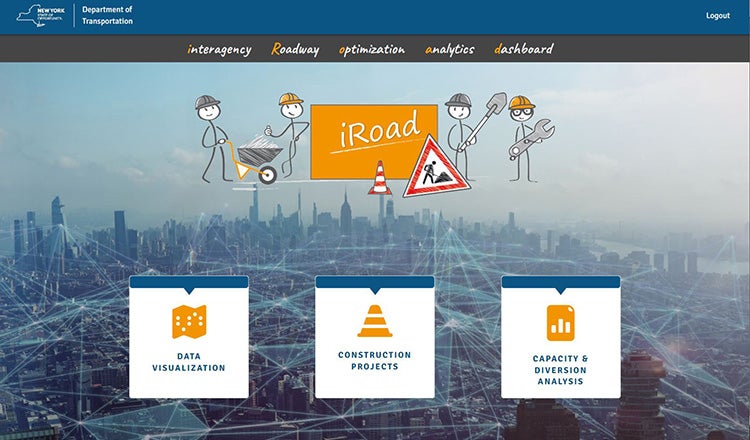
NYC Interagency Roadway Optimization Analytics Tool

NYC Interagency Roadway Optimization Analytics Tool
Planning Dashboard Helps Coordinate Road Closures Among New York City Transportation Agencies
Coordinating road construction closures in America’s largest city is a complex undertaking due to the city's massive size, population density and need to ease disruptions to both traffic flow and residents.
The New York State Department of Transportation wanted to support transportation agencies in the New York City area to coordinate road closures, and HDR was tasked with creating a web-based tool called iRoad, or Interagency Roadway Optimization Analytics Dashboard.
The application speeds up the analysis process to offer quicker insights into the effect of roadway closures, a major benefit for the many agencies that do road work in the city, including MTA Bridges and Tunnels, the Port Authority of New York and New Jersey, the New York City Department of Transportation and other local entities.
The sketch-level planning tool represents a significant step forward for planning road closures and reducing disruptions to residents and commuters.
Streamlined Traffic Analysis
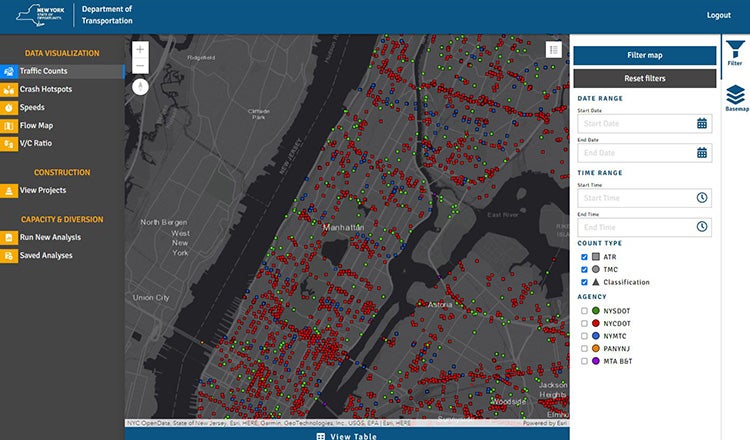
The iRoad tool has two main parts: Data visualization, as well as capacity and diversion.
In the first part, historical traffic volume data, crash hotspots and speed are compiled and run through machine-learning algorithms to craft traffic maps that visually detail the volume and capacity of tens of thousands of New York City roads.
The capacity and diversion tool uses the traffic data to measure the impact of a proposed lane closure location, time and area of interest selected by engineers. This creates an easy way to inform decision-making before implementing a road closure, providing a detailed traffic analysis in as little as five minutes.
The resulting analysis helps planners determine whether a roadway can be closed and allows them to explore multiple scenarios to find the best option. Its simple interface and initial analysis are meant to help, not replace traffic engineers. If the application says a closure is feasible, a traffic engineer is then contacted to develop more detailed plans.
The iRoad tool can also identify the impact that current construction projects have on potential road closures. Transportation agencies upload their current construction projects into the system to be used as another data point when running a diversion analysis.
Before iRoad, planning for short- or long-term closures began with a data intensive process of finding and gathering data from different transportation agencies, then processing and analyzing that data. Altogether, the initial analysis could take one to four weeks to complete. But with iRoad, that first step is drastically condensed.
Understanding and Preparing for Traffic, Road Projects
Along with providing coordination among NYC agencies, iRoad was built to find the most efficient path forward for permit application and planning.
Historical traffic counts, time/speed and crash hotspots are supplied by various traffic agencies and are manually entered into the database every six to 12 months. This data is run through the machine learning algorithm to develop the traffic flow maps that are the basis for all traffic and diversion analysis.
Since being rolled out by the NYSDOT, the iRoad diversion tool has been used more than 80 times to determine the next best steps when deciding road closures.
The findings have reduced project engineering costs and allowed traffic engineers to spend more time on other areas of large-scale road construction projects.


