Business Decisions Using Asset Management Data & Findings
Asset Management Data and Findings
Not long ago, asset management was an unfamiliar term in the water industry. In the span of a decade, it has become clear that asset management is more than a program that is implemented; it is an approach and way of thinking that requires a transformation in organizational alignment and culture to be truly effective. When implemented correctly, asset management yields benefits such as higher performance levels, greater consistency, optimized expenditures, and sustainable service delivery. Across a wide spectrum of assets and industries, organizations are finding significant gains in performance, while balancing risk and level of investment.
The International Organization for Standardization developed the ISO 55000 Asset Management standard in 2014, which defines asset management as “the coordinated activity of an organization to realize value from assets.” It further states that “realization of value will normally involve a balancing of costs, risks, opportunities, and performance benefits.” Accomplishing this requires an organization to understand the impact that its decisions and actions have on individual assets and the value those individual assets provide toward achieving goals for service delivery and regulatory compliance. Organizations that have developed these asset management capabilities to a high level of maturity are able to:
- Collect the appropriate asset data, convert this data to information, and use it to make asset management decisions to achieve performance goals while balancing risk and cost
- Justify the timing and costs of capital projects
- Easily identify which capital projects to defer if funding issues arise
- Understand the risk profile of their various assets and how this profile will change versus time
- Clearly demonstrate and communicate the business consequences of increasing or decreasing maintenance and/or capital investment levels
- Understand resource needs over time and which functions and capabilities to build into the organization and which to outsource
Three of the main business decisions for asset management include:
- Decision-Making for Strategic Use of Resources
- Decision-Making for Optimizing Capital Investment
- Decision-Making for Optimizing Operations and Maintenance
San Antonio Water System is in the midst of a multiyear sanitary sewer overflow reduction program. We are providing program management support services for the SAWS SSO Reduction Program and, as part of this effort, have supported SAWS with implementing guidelines, approaches, and tools to accomplish each of these decision-making processes.
Decision-Making for Strategic Use of Resources
Asset management plans and initiatives rely upon capital and operational expenditures as well as a structured staffing plan and resourcing strategy. We designed a process to develop a strategy and worked with SAWS to develop a detailed staffing plan and resourcing strategy for their $1.2 Billion SSO Reduction Program.
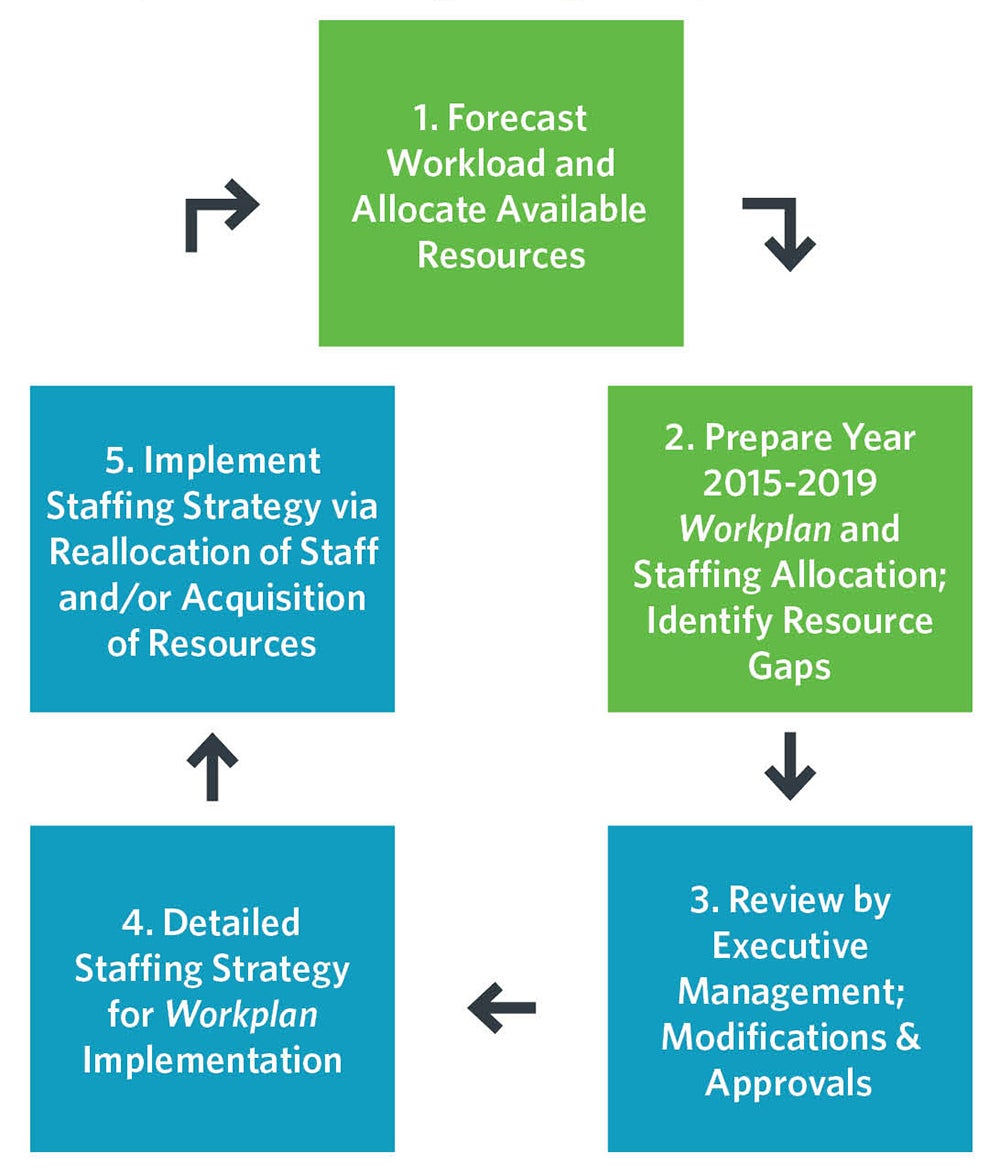
By utilizing this process, SAWS was able to identify the total workload in person-hours per year for all activities, convert
the workload into full-time-equivalent employees, and determine existing staffing, consultant and contractor resources available.
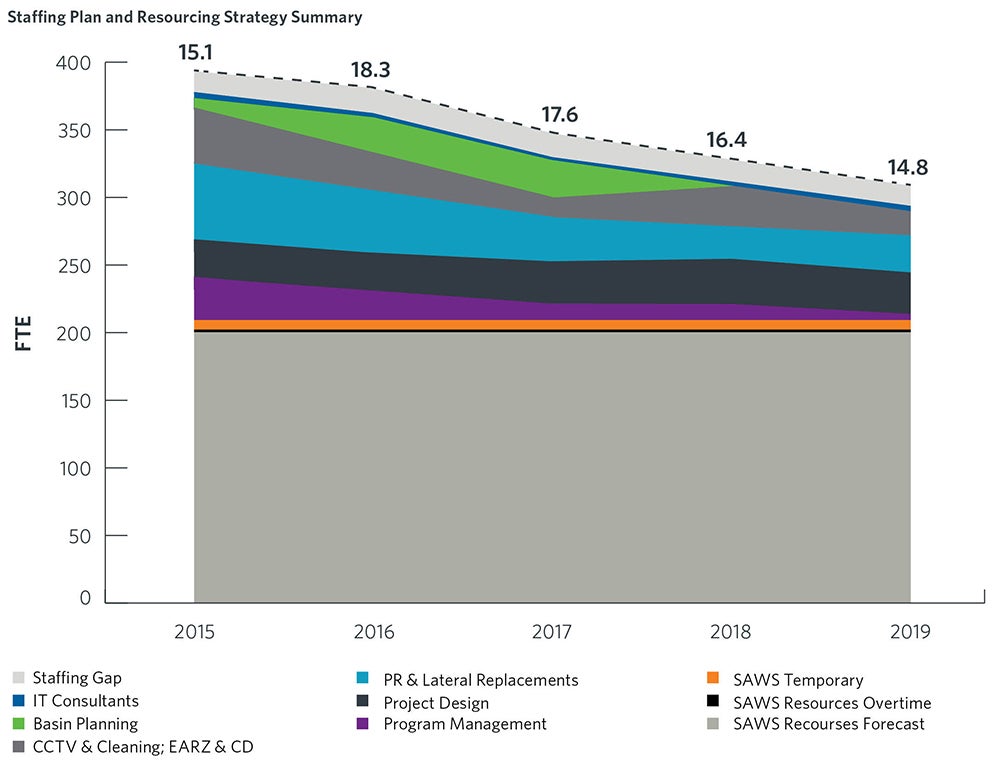
By comparing workload to available resources for each functional area, SAWS was able to identify staffing shortages and surpluses (see Figure 1). This process enabled SAWS to identify where shortages existed, make decisions to reallocate surplus resources, and develop a future staffing plan to fill the gap with new hires, temporary staff, overtime, consultants and contractors.
Decision-Making for Optimizing Capital Investment
Stakeholders, including elected officials and policymakers, are requiring detailed justifications for capital investment programs. Many organizations do not have the information required to adequately justify asset rehabilitation and replacement. This is often exacerbated by low-quality or poorly populated asset databases, including asset inventory, condition, deterioration rates, and future costs for operations and maintenance.
Optimization of capital investment decision-making requires an understanding of the investment trade-off between capital investment versus maintenance costs, and the risk associated with asset failure. The SAWS SSO Reduction Program has been working to optimize capital investment over the past five years. As sewer inspection data was collected, SAWS analyzed data to determine the condition of the sewer system. SAWS implemented a report card-style approach for assessing the condition of sewer pipe segments. It consisted of an A to E condition grading system, with A assigned to pipes in excellent condition, E assigned to pipes in very poor condition, and B, C, and D assigned to intermediate condition grades.
Beginning in 2013, as data was being collected in the early stages of the program, SAWS and HDR used the available condition assessment data to forecast the total quantity of sewer point repairs, rehabilitation and replacement that would ultimately be needed once all condition assessment was completed. This provided SAWS management the information needed to make business decisions on levels of investment moving forward. Specific activities utilized to implement this process include:
- Sort assets into asset classes (similar installation date, material and diameter)
- Identify the repair, rehabilitation and replacement rate for each class
- Perform analysis to identify asset classes with elevated sewer overflow risk
- Project these renewal rates on the uninspected pipes in each asset class with elevated SSO failure risk
Using this approach, we estimated that approximately 100 miles of pipelines would require condition remediation through point repair, rehabilitation, or replacement, along with an additional 250 miles that would require either condition remediation or ongoing condition monitoring. Based on these results, SAWS estimated the amount of capital investment required to reduce the risk of condition-related sewer overflows.
Both the SSO failure risk analysis and capital investment projections were based on asset management data collected over many years, including:
- An asset register defining all of the sewer system assets
- Maintenance history identifying the assets where sewer overflows and maintenance issues have occurred in the system used to determine failure risk
- Inspection data and condition assessment findings by asset used to characterize system condition and project capital investment needs
As of October 2015, SAWS has implemented several key enhancements to improve their ability to optimize capital investment. These enhancements include:
- Standards for Closed Circuit Television inspection and guidelines for condition assessment and condition remedial measures alternatives analysis
- A sewer pipeline risk assessment framework with likelihood of failure and consequence of failure factors that is used to prioritize condition remediation activities
We are supporting SAWS with the implementation of decision support tools that will support risk assessment, CCTV data quality control, condition assessment, and condition remediation decisions. These tools have enabled SAWS to consistently apply decision-making guidelines to optimize and risk assessment to prioritize capital investment. At the end of 2017, 100 percent of the high-risk assets in the system have been inspected and assessed, and the repairs, rehabilitation and replacement identified were within 10 percent of the original forecast.
Decision-Making for Optimizing Operations and Maintenance
Across the industry, operations and maintenance costs are being scrutinized with the goal of lowering overall costs. An organization needs to understand the right maintenance activities to be performing, allow for the appropriate frequency to perform those activities, and have a system in place to continually monitor and determine if either of those should change.
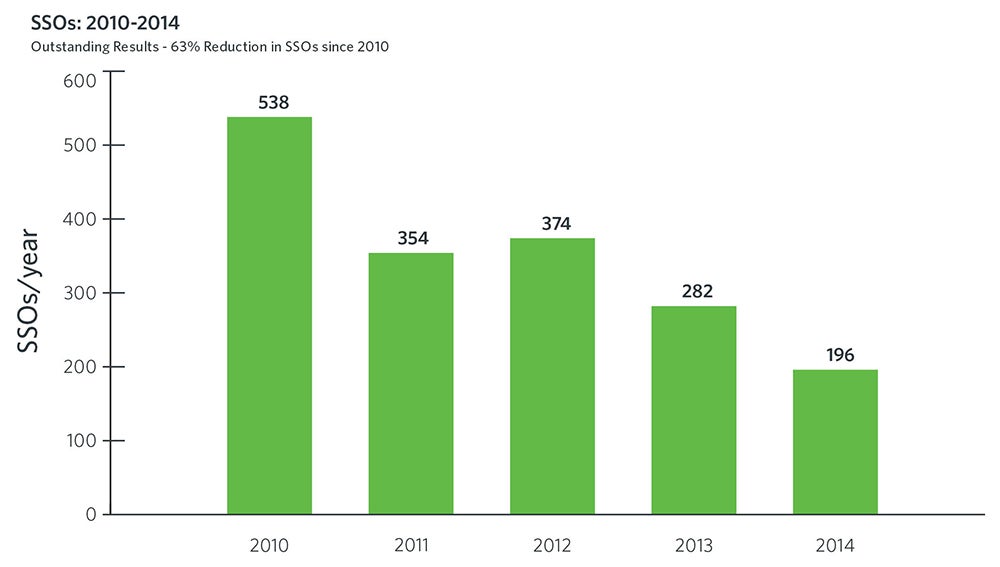
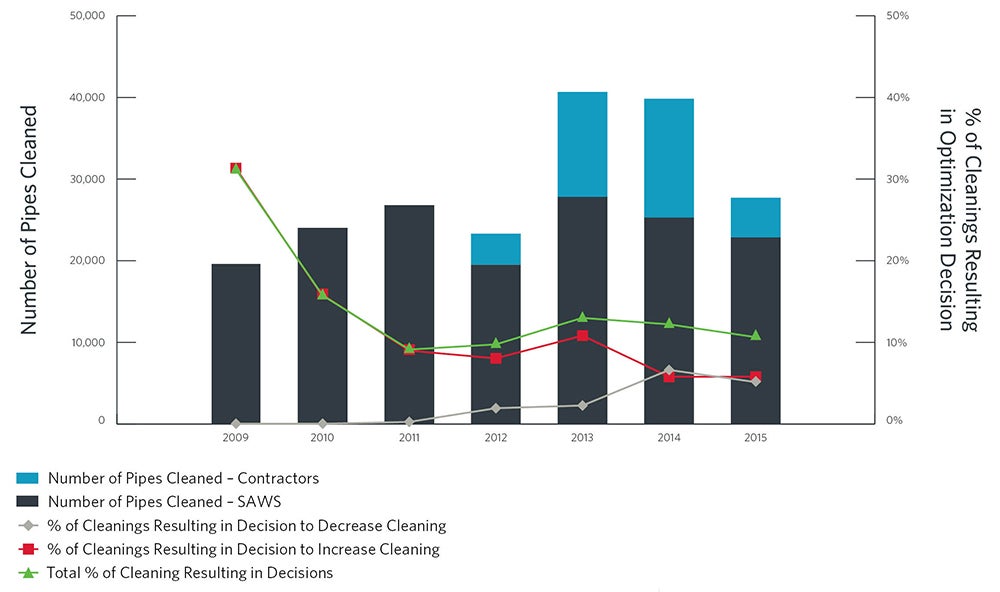
In San Antonio, we have worked with SAWS to implement maintenance optimization decision-making guidelines. These are reflected in a set of optimization algorithms that generate recommendations to optimize maintenance activities for SAWS staff to review for approval. The rules governing maintenance optimization recommendations incorporate data from sewer cleaning crews, CCTV crews, and resulting from other events such as sewer backups and sewer overflows. The guidelines for maintenance optimization are embedded in computer algorithms within a software module called COTools. We created COTools and integrated it with SAWS’ Hansen Computerized Maintenance Management System. If SAWS staff accepts a maintenance optimization recommendation, then maintenance frequencies and schedules are updated in the Hansen CMMS. The process has proved extremely effective in supporting SAWS to continually optimize cleaning resources to focus more attention on problem locations in the sewer system to reduce sewer overflows, while at the same time reducing sewer cleaning on assets where an acceptable level of performance could be achieved with less effort.
The combination of increased cleaning, increased CCTV inspection and sewer cleaning maintenance optimization has resulted in a 63 percent reduction in sewer overflows since 2010. Cleaning the right sewer pipes at the right time has played a key role in this reduction.