
A Decade of Data-Driven Transformation: Process, Practice & the Interface of Data & Design
Over the past decade, the design industry has been irrevocably transformed by the unprecedented growth and influence of big data. From artificial intelligence to the Internet of Things and a workforce evolution, the omnipresence of data is transforming the delivery of design and shaping the future of our built environment.
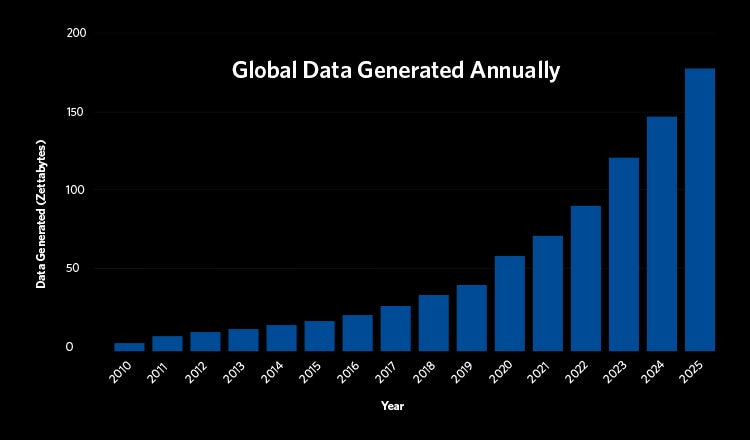
To put this in perspective, over 2.5 quintillion bytes of data are generated every day, and global data volumes are expected to surpass 175 zettabytes by 2030, continuing to grow exponentially in the years beyond. In this climate of abundance, there is so much that we, as designers, can learn about utilizing objective, quantifiable evidence to make our practice durable for the future, strengthen our business operations, and create powerful new tools of innovation.
Volume, Variety & Velocity
In the past, data has often been challenging to acquire, with only modest amounts capable of being extracted and processed at any one time. Slowly but surely, however, we have witnessed data transform from a single source to a multi-object, multi-criteria, multi-scenario decision-making metric based on the large volume, variety and velocity of data now available to us – otherwise known as big data.
Using data lakes (a repository of data stored in its raw format), warehousing (a system that aggregates data from different sources into a central data store) and mining techniques (to extract and discover patterns), we can now effectively collect big data from diverse sources and synthesize it into patterns and correlations that no longer rely on preconceived assumptions. This methodology is not only more objective and insight-led, but it can better serve the more dynamic, complex and deeply technical projects that we are delivering today.
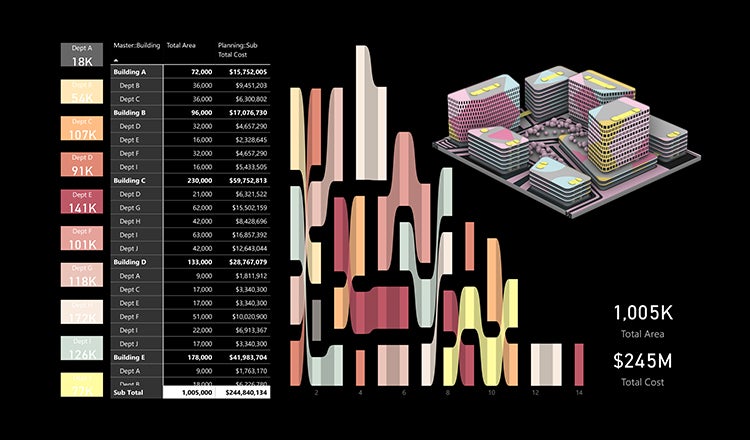
Some applications of big data at HDR include using computational analysis to measure the utilization, productivity and occupancy variables of tertiary education facilities at Western Sydney University’s new 18-story Bankstown City Campus. In the defense sector, we have extrapolated operational data from training facilities to aid the design of energy-efficient, highly adaptable spaces that can be reconfigured for future use or expansion. Meanwhile, our ‘Greenhouse Gas Emissions Reduction Targets Study’ in New York has examined how energy is being issued across building stock, with big data collected to assess current energy performance and reduce emissions across the city.
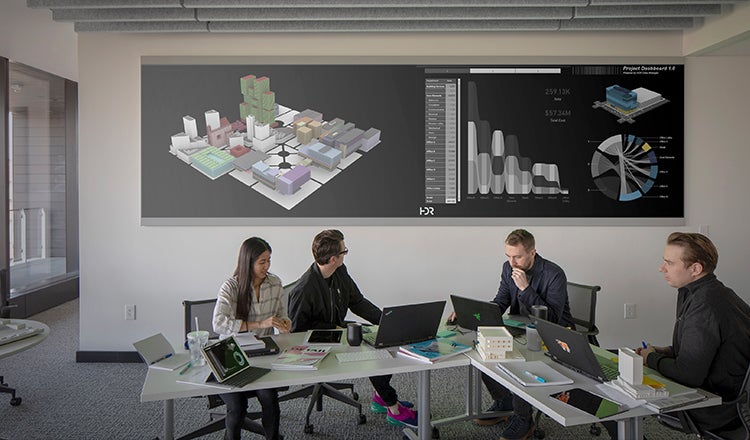
With big data analytics and data dashboards like these now in play, we have an enhanced ability to design in a more quantifiable manner, as well as a much deeper and research-informed capability to verify theories and make big design decisions faster.
Workflow Transformation
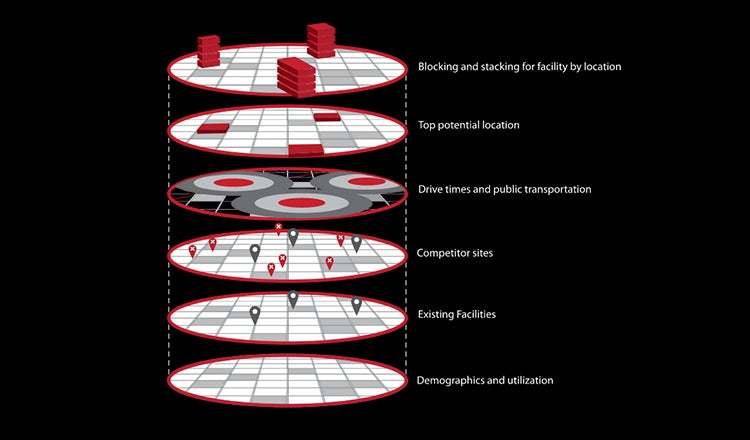
As practitioners, we have also observed a significant shift in our workflow over the past decade. Hand-drawn sketches have been replaced by digital illustrations, and our architectural design process has evolved from line-based drawings to object-oriented, multi-dimensional, data-rich information models such as building information modelling and a geographic information system. Platforms like Autodesk, Graphisoft, Esri and dRofus are not only enhancing our workflow, but they are enabling improved integration, coordination and cross-disciplinary collaboration.
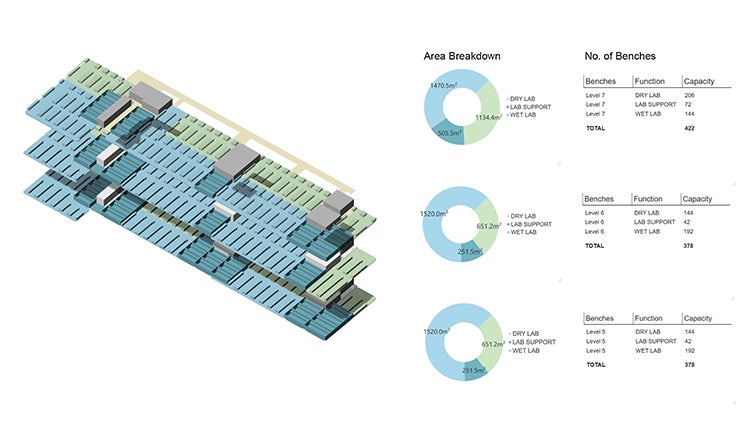
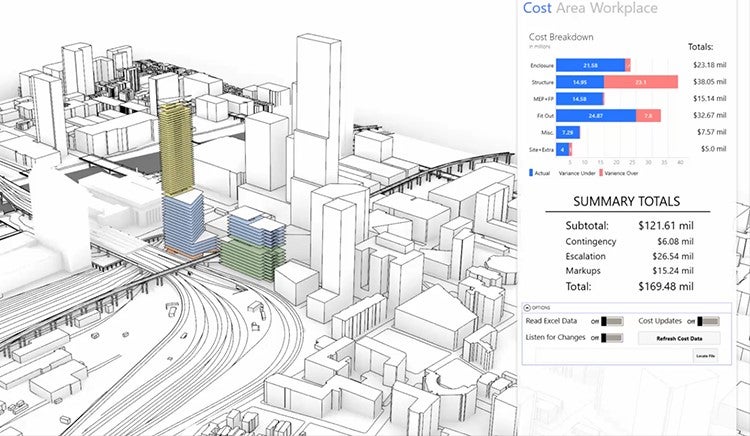
At HDR, for example, we utilize these platforms alongside a suite of in-house computational design tools to design data-driven solutions to some of our most complex challenges. Using our own data management infrastructure Data Wrangler, we are developing a variety of innovative and proprietary tools that can assist our clients in making informed decisions about space utilization, operating cost, embodied carbon and occupancies. Some examples include a Master Planning Tool, Data Centre Dreamer Tool, Solar Field Tool and Lab Planner Tool.
Some of these tools have been applied to the HDR-designed NEXTDC Merlot 2 and Merlot 3 data centers, the University of Sydney’s Biomedical Accelerator, Macquarie University STEM Masterplan, and The Pavilion at the Hospital of the University of Pennsylvania, to name but a few. Beyond projects, we have also used computational design tools to compile 47 climate and environmental data sets that can establish a strong sustainability baseline for new projects in the U.S.
Seeing Double
Today, a new phenomenon is further transfiguring the interface between data and design. Known as a digital twin, this new way of visualizing design is challenging designers to think differently and arming us with the tools to form comprehensive digital representations of building structures and urban environments that can measure the ecological, social, cultural and financial subsets of our projects more holistically.
Using digital processes and sub-processes, we now have the ability to consider architectural design, structural components and building systems in real-time so that performance, maintenance and operations can be better optimized, and theories can be verified faster. Daylight access, heating and cooling loads, solid-to-glass ratios or ‘typical room sizes’ that can be tested rapidly are just a few examples. The scope of digital twin technology also extends beyond the design phase, integrates with post-occupancy operations, and goes beyond the delivery of a mere BIM model to create highly customized solutions that address the unique needs and pain points of end users.
This physical-meets-digital approach is being successfully utilized across many sectors including build-to-rent, hospitals, laboratories, universities and transit-oriented developments such as Toronto’s Ontario Line. As the fastest-growing metro area in North America, the new 16-kilometre rapid transit subway line has 15 proposed stations for an expected 400,000 daily boardings. To deliver a technical advisory service for a complex project of this size, HDR has built a digital twin using GIS mapping and spatial analytics software Esri to enable the dynamic integration of 2D and 3D information across the entire rail line. This includes the stations, services, neighboring buildings and adjacent infrastructure in the city.
Using GIS information from HDR and stakeholder databases, reality mesh data, 16 kilometers worth of detailed point cloud scans, 2D computer-aided design data and 3D BIM models, the Ontario Line GIS Hub seamlessly integrates technological tools through an intuitive user interface. It is also providing everyone, including the transit authority, with the ability to access informed, accurate and reliable data through nothing more than a 3D web-based platform.
Towards Hybrid Intelligence
The third summer of AI is upon us. This time, unlike the AI winters of the 1970s and early 1990s, we are witnessing a convergence of factors that will have a perpetual impact on the design industry. Today, increasingly powerful machine learning text-to-image models such as DALL·E, Mid-Journey, and Stable Diffusion can take natural language as input to generate creative images that could revolutionize the way architects communicate design intent moving forward. Previously, photo-realistic architectural renderings took days to produce and required highly detailed 3D models, but now text-to-image models can generate, modify and finalize visualizations in mere minutes, even from rough models or hand sketches.
At HDR, we are conducting early-stage exploration of a human-in-the-loop approach that can integrate our human expertise and in-house tools with AI capabilities to streamline the design process, explore a more extensive range of design possibilities, and achieve enhanced outcomes on complex tasks such as architectural design. Ultimately, by leveraging the combined strengths of human intuition and AI’s computational power, AI models could become our creative partners and aid us to iteratively refine complex, highly technical typologies in collaboration with our clients.
For instance, instead of drawing master plan options one-by-one, designers can use generative systems to produce 100 options instantaneously and evaluate such options through a hybrid process involving both data-driven analytics and human expertise. We can also efficiently revise 500 hospital rooms at once, test fit for optimal building stock utilization in a campus and determine the maximum attainable solar power in a solar farm with the most efficient layout in minutes.
The Human Touch
Moving forward, we have the potential to exceed our capability far beyond what is deemed possible for human designers. More options, however, are not ends in themselves and would ultimately give us time back to consider the human experience.
Being able to design with empathy and humanize data-driven design will undoubtedly set us apart moving forward. AI is still a black box, and we will continue to have the upper hand by acting as a medium between the technology at play and the final product itself. With this significant responsibility comes a vigilance in the exploration of AI to ensure data practices best serve our professions, industries and communities.
We are at a technological crossroads and, as we work towards a future that embraces hybrid intelligence but remains human-centered at its heart, we will continue to rely on our own creativity and intuition. By acknowledging the limitations of data, whether that be implicit human bias or misrepresentation of minority groups, we will collectively retain our deeper and more inherent understanding of the problems and realities of the people for which we are designing.
A Data-Driven Future
As the legendary statistician and engineer W. Edwards Deming once said: “Without data, you’re just another person with an opinion.” Today, research-backed, insight-led, data-informed design is fast becoming the basic infrastructure for how we deliver projects. With colossal amounts of information from versatile sources being accumulated, deposited and automated every day, we are now in a unique position to operate at the interface of data and design to deliver expedited, quantifiable solutions underpinned by human-inspired technical and creative excellence. By bridging the gap between the physical and digital worlds, and continuing to design with empathy, we can create more robust building blocks to help humanity thrive and set a new benchmark as trusted experts and problem solvers.
As seen in InDesign.
Over the past decade, the design industry has been irrevocably transformed by the unprecedented growth and influence of big data. From artificial intelligence to the Internet of Things and a workforce evolution, the omnipresence of data is transforming the delivery of design and shaping the future of our built environment.
To put this in perspective, over 2.5 quintillion bytes of data is being created, captured, copied and consumed every day, with the world expected to generate 163 zettabytes (pdf) of data by 2025. In this climate of abundance, there is so much that we, as designers, can learn about utilizing objective, quantifiable evidence to make our practice durable for the future, strengthen our business operations, and create powerful new tools of innovation that will propel us into 2030.
Volume, Variety & Velocity
In the past, data has often been challenging to acquire, with only modest amounts capable of being extracted and processed at any one time. Slowly but surely, however, we have witnessed data transform from a single source to a multi-object, multi-criteria, multi-scenario decision-making metric based on the large volume, variety and velocity of data now available to us – otherwise known as big data.
Using data lakes (a repository of data stored in its raw format), warehousing (a system that aggregates data from different sources into a central data store) and mining techniques (to extract and discover patterns), we can now effectively collect big data from diverse sources and synthesize it into patterns and correlations that no longer rely on preconceived assumptions. This methodology is not only more objective and insight-led, but it can better serve the more dynamic, complex and deeply technical projects that we are delivering today.
Some applications of big data at HDR include using computational analysis to measure the utilization, productivity and occupancy variables of tertiary education facilities at Western Sydney University’s new 18-story Bankstown City Campus. In the defense sector, we have extrapolated operational data from training facilities to aid the design of energy-efficient, highly adaptable spaces that can be reconfigured for future use or expansion. Meanwhile, our ‘Greenhouse Gas Emissions Reduction Targets Study’ in New York has examined how energy is being issued across building stock, with big data collected to assess current energy performance and reduce emissions across the city.
With big data analytics and data dashboards like these now in play, we have an enhanced ability to design in a more quantifiable manner, as well as a much deeper and research-informed capability to verify theories and make big design decisions faster.
Workflow Transformation
As practitioners, we have also observed a significant shift in our workflow over the past decade. Hand-drawn sketches have been replaced by digital illustrations, and our architectural design process has evolved from line-based drawings to object-oriented, multi-dimensional, data-rich information models such as building information modelling and a geographic information system. Platforms like Autodesk, Graphisoft, Esri and dRofus are not only enhancing our workflow, but they are enabling improved integration, coordination and cross-disciplinary collaboration.
At HDR, for example, we utilize these platforms alongside a suite of in-house computational design tools to design data-driven solutions to some of our most complex challenges. Using our own data management infrastructure Data Wrangler, we are developing a variety of innovative and proprietary tools that can assist our clients in making informed decisions about space utilization, operating cost, embodied carbon and occupancies. Some examples include a Master Planning Tool, Data Centre Dreamer Tool, Solar Field Tool and Lab Planner Tool.
Some of these tools have been applied to the HDR-designed NEXTDC Merlot 2 and Merlot 3 data centers, the University of Sydney’s Biomedical Accelerator, Macquarie University STEM Masterplan, and The Pavilion at the Hospital of the University of Pennsylvania, to name but a few. Beyond projects, we have also used computational design tools to compile 47 climate and environmental data sets that can establish a strong sustainability baseline for new projects in the U.S.
Seeing Double
Today, a new phenomenon is further transfiguring the interface between data and design. Known as a digital twin, this new way of visualizing design is challenging designers to think differently and arming us with the tools to form comprehensive digital representations of building structures and urban environments that can measure the ecological, social, cultural and financial subsets of our projects more holistically.
Using digital processes and sub-processes, we now have the ability to consider architectural design, structural components and building systems in real-time so that performance, maintenance and operations can be better optimized, and theories can be verified faster. Daylight access, heating and cooling loads, solid-to-glass ratios or ‘typical room sizes’ that can be tested rapidly are just a few examples. The scope of digital twin technology also extends beyond the design phase, integrates with post-occupancy operations, and goes beyond the delivery of a mere BIM model to create highly customized solutions that address the unique needs and pain points of end users.
This physical-meets-digital approach is being successfully utilized across many sectors including build-to-rent, hospitals, laboratories, universities and transit-oriented developments such as Toronto’s Ontario Line. As the fastest-growing metro area in North America, the new 16-kilometre rapid transit subway line has 15 proposed stations for an expected 400,000 daily boardings. To deliver a technical advisory service for a complex project of this size, HDR has built a digital twin using GIS mapping and spatial analytics software Esri to enable the dynamic integration of 2D and 3D information across the entire rail line. This includes the stations, services, neighboring buildings and adjacent infrastructure in the city.
Using GIS information from HDR and stakeholder databases, reality mesh data, 16 kilometers worth of detailed point cloud scans, 2D computer-aided design data and 3D BIM models, the Ontario Line GIS Hub seamlessly integrates technological tools through an intuitive user interface. It is also providing everyone, including the transit authority, with the ability to access informed, accurate and reliable data through nothing more than a 3D web-based platform.
Towards Hybrid Intelligence
The third summer of AI is upon us. This time, unlike the AI winters of the 1970s and early 1990s, we are witnessing a convergence of factors that will have a perpetual impact on the design industry. Today, increasingly powerful machine learning text-to-image models such as DALL·E, Mid-Journey, and Stable Diffusion can take natural language as input to generate creative images that could revolutionize the way architects communicate design intent moving forward. Previously, photo-realistic architectural renderings took days to produce and required highly detailed 3D models, but now text-to-image models can generate, modify and finalize visualizations in mere minutes, even from rough models or hand sketches.
At HDR, we are conducting early-stage exploration of a human-in-the-loop approach that can integrate our human expertise and in-house tools with AI capabilities to streamline the design process, explore a more extensive range of design possibilities, and achieve enhanced outcomes on complex tasks such as architectural design. Ultimately, by leveraging the combined strengths of human intuition and AI’s computational power, AI models could become our creative partners and aid us to iteratively refine complex, highly technical typologies in collaboration with our clients.
For instance, instead of drawing master plan options one-by-one, designers can use generative systems to produce 100 options instantaneously and evaluate such options through a hybrid process involving both data-driven analytics and human expertise. We can also efficiently revise 500 hospital rooms at once, test fit for optimal building stock utilization in a campus and determine the maximum attainable solar power in a solar farm with the most efficient layout in minutes.
The Human Touch
Moving forward, we have the potential to exceed our capability far beyond what is deemed possible for human designers. More options, however, are not ends in themselves and would ultimately give us time back to consider the human experience.
Being able to design with empathy and humanize data-driven design will undoubtedly set us apart moving forward. AI is still a black box, and we will continue to have the upper hand by acting as a medium between the technology at play and the final product itself. With this significant responsibility comes a vigilance in the exploration of AI to ensure data practices best serve our professions, industries and communities.
We are at a technological crossroads and, as we work towards a future that embraces hybrid intelligence but remains human-centered at its heart, we will continue to rely on our own creativity and intuition. By acknowledging the limitations of data, whether that be implicit human bias or misrepresentation of minority groups, we will collectively retain our deeper and more inherent understanding of the problems and realities of the people for which we are designing.
A Data-Driven Future
As the legendary statistician and engineer W. Edwards Deming once said: “Without data, you’re just another person with an opinion.” Today, research-backed, insight-led, data-informed design is fast becoming the basic infrastructure for how we deliver projects. With colossal amounts of information from versatile sources being accumulated, deposited and automated every day, we are now in a unique position to operate at the interface of data and design to deliver expedited, quantifiable solutions underpinned by human-inspired technical and creative excellence. By bridging the gap between the physical and digital worlds, and continuing to design with empathy, we can create more robust building blocks to help humanity thrive and set a new benchmark as trusted experts and problem solvers.
As seen in InDesign.


