
Experts Talk: Data-Informed Equitable Engagement with Chelsea Collinge and Sabrina Colón
Experts Talk is an interview series with technical leaders from across our transportation program.
Improving Transportation Projects Through Community Data Analysis


Infrastructure design is most successful when it reflects the voices and values of the public and communities it serves. It’s especially important to hear from groups who have traditionally been underrepresented in the outreach process. But it can be difficult to reach every community through traditional public meetings and engagement strategies. Data-informed engagement approaches, on the other hand, can uncover and analyze the unique needs and characteristics of communities. The result is an engagement approach that improves understanding of the residents who may be impacted and leads to better, more informed planning and design.
In this Experts Talk interview, our strategic communications professionals Chelsea Collinge and Sabrina Colón explain how this data-informed engagement is being used on projects and show how it is creating more equitable infrastructure. Collinge has worked across the U.S. to meaningfully engage with communities in Arizona, Washington, Nevada and more through data-informed strategies. Colón is our South Atlantic strategic communications lead and puts these strategies into practice daily in her work as communications manager for the major CONNECT Beyond transit planning project in Charlotte, North Carolina.
Data-Informed Equitable Engagement
Q. How does demographic and data analysis inform transportation projects?
Collinge: Utilizing demographic data and community analytics is not a new concept for infrastructure program implementation. Most often that information is used in the early planning process to document who and what will be impacted by the construction and operation of a project. However, we can also use this data to understand how best to reach individuals and how they are most comfortable engaging on a project.
Our teams combine publicly available demographic, socioeconomic, health and environmental data, as well as a host of other locally relevant metrics like communication preferences or access to broadband. This results in an in-depth snapshot of stakeholders in each area, allowing for a comprehensive understanding and more tailored approach to strategic engagement. For example, we can see how housing patterns or demographics have changed over time, allowing us to discover disparities in access to needed services or other features that impact quality of life.
Collinge: We utilize the expertise combination of geospatial and strategic communications professionals. Together, these practitioners use readily available, public data to inform and enhance the approach to designing community engagement actions.
Our process helps us understand the unique needs of our communities. We use publicly available geographic information system mapping, or GIS, to study the human geography of our projects, including at-risk or overburdened populations. We look at publicly available environmental data, such as proximity to floodplains or pollution. And we put it all together to help project teams develop effective engagement strategies — strategies as diverse as their audiences.
Q. Data is a very broad topic, with lots of applications. How do we approach new projects and what specific deliverables do we typically provide?
Collinge: Our team starts each project with an intake process by building two pillars of public data to build our understanding of community dynamics:
- People data, which is predominantly demographic, socioeconomic, health and behavioral, and mobility information on who is in a community
- Environment data, which looks at the purpose of the project, whether it is driven by congestion, aging infrastructure, growing population, etc.
We take all of that data, combine it, and document key trends and highlights. This helps us plan better engagement approaches that meet community needs. This data-informed framework drives the development of a customized and intentional engagement strategy that makes sense for the individuals in that community.

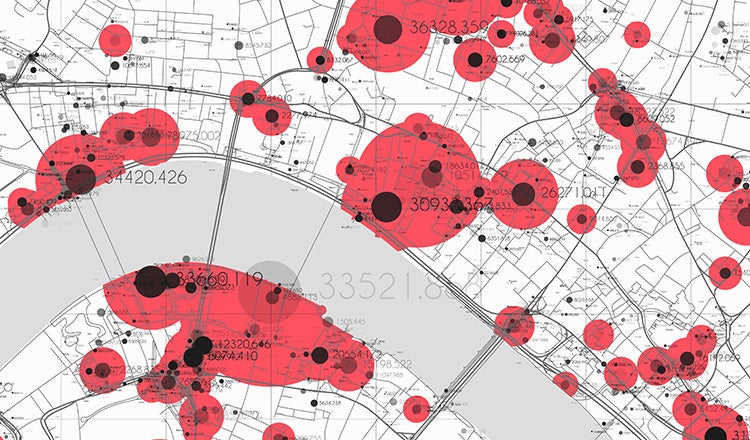
Colón: We can quickly produce reports, interactive maps, dashboards and infographics that create a visual profile of a given area. By gathering, layering and visually presenting information, we can tell impactful stories about a project area.
One important part of the process is identifying and extracting critical variables for the project areas. It could mean developing business summaries for the custom project area or pulling out minority, disability, income and age population statistics. These measures can show which populations and businesses would be most affected — positively or negatively — by specific projects.
This data is complemented by spatially enabled market potential information, from which we can assess disposable income spending, as well as expenditures on retail, health, recreation and more. These assessments provide a comprehensive visual and statistical understanding of a project’s community and inform engagement strategies. For example, if we know that community members prioritize recreation and family-friendly activities, we can organize an event at a local park. Or if health spending is particularly high, we can begin community dialogues about how a transportation project could affect air quality or access to health care.
Q. How is this information received and then used to improve traditional engagement and project planning?
Colón: We use this data as the basis for our public involvement and engagement plans. For example, we can see if there's a group that doesn't have access to technology or has language barriers and then we can adjust as needed to reach those groups.
Knowing when community members are available and what their interests are has also allowed us to hold culturally aligned events such as night markets, where we partner with local vendors to help draw participants for engagement with the project team. When our data showed that many of the communities we worked with in the Charlotte area were predominately transit-dependent, we organized community ambassadors, who rode transit lines to speak with other riders and who provided direct feedback on their experience and what they heard from others to the project team.
In a long-term project, the data collection also allows us to go back and check, helping us know whether we succeeded in reaching each community in a project area. If our engagement is only reaching a certain group, we can adjust and implement more targeted outreach to missing groups to ensure we better understand the needs of a whole community.
Q. How have clients used these strategies to craft more equitable projects?
Collinge: By leveraging a broad range of interactive publicly available geospatial datasets we can shed light on those who are traditionally left out — whether that’s because of their age, income, language barriers or other conditions. We help our clients better understand the unique needs of their communities and provide inclusive solutions. For example, in Kitsap County, Washington, we developed an overburdened community assessment that compares 23 demographic, socioeconomic, health and environment metrics from federal, state and private sources to help guide the county and its partner agencies toward meaningful, inclusive and equitable outreach. They will use this assessment to inform and prioritize their efforts as they continue to make investments in their community.
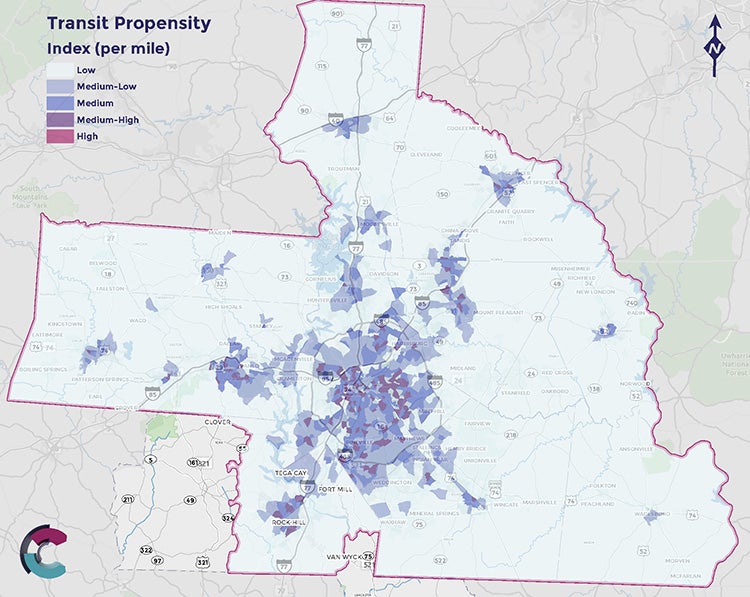
Colón: In North Carolina, we gathered data as part of CONNECT Beyond, a regional mobility plan that will set the transit vision for a 12-county region for the next two decades. The information we’ve gathered has been used to build a transit propensity index that identifies specific demographic factors that indicate likeliness to use public transit, including minority identity, low-income status, disability, age and more.
This equity analysis has helped identify potential high-capacity transit corridors and confirmed that current planning matches the areas of greatest need. We were also able to show how transit lines connect affordable housing locations to essential services such as hospitals or employment centers. In other words, we can quantify where transit is needed the most in this community. That data has helped us focus on how transit can be a solution to some of the upward mobility and housing challenges in the community.
Sharing this data publicly has also helped people understand decisions made in this comprehensive plan, including why it’s important to make improvements across the entire network to ensure that we're benefiting the populations that need it most.
Q. What else should agencies know about the value of incorporating equity data analysis in their transportation planning efforts?
Collinge: Data should inform an approach, not “drive” it. Data analysis is important, but more important is having a clear sense of the communities we serve. Whether we are trying to identify vulnerable or underserved communities who haven’t been adequately represented in previous planning efforts, or refining an outreach strategy due to low participation, no one knows a community better than those living in it. The findings of any community analysis should be developed in coordination with communication practitioners who live in and/or deeply understand the area. Through this, the best data-informed engagement can be achieved.
Colón: Yes, getting the most out of the data requires digging deeper and planning thoughtfully. Generating reports is great, but if they're not used effectively, then they're just reports.
There can be an assumption that just having the data means we will also have all the answers. But the analysis of data often leads to more questions, not more answers. What data does is allow us to open conversations with community groups to help put context to the data and tell us the “why” behind data as well as the “what.”
The process can be very exploratory and requires thinking about what the data says and how we should respond to it. What our teams offer is not just collection, but expertise in interpreting this data and working with a community to analyze its implications for a region and specific projects. It’s not always quick and easy. But the payoff is impactful, valuable projects that best serve and are embraced by their communities.
Each Experts Talk interview illuminates a different aspect of transportation infrastructure planning, design and delivery. Check back regularly to discover new insights from the specialized experts and thought leaders behind our award-winning, full service consulting practice.


